 Tech Exec Insight
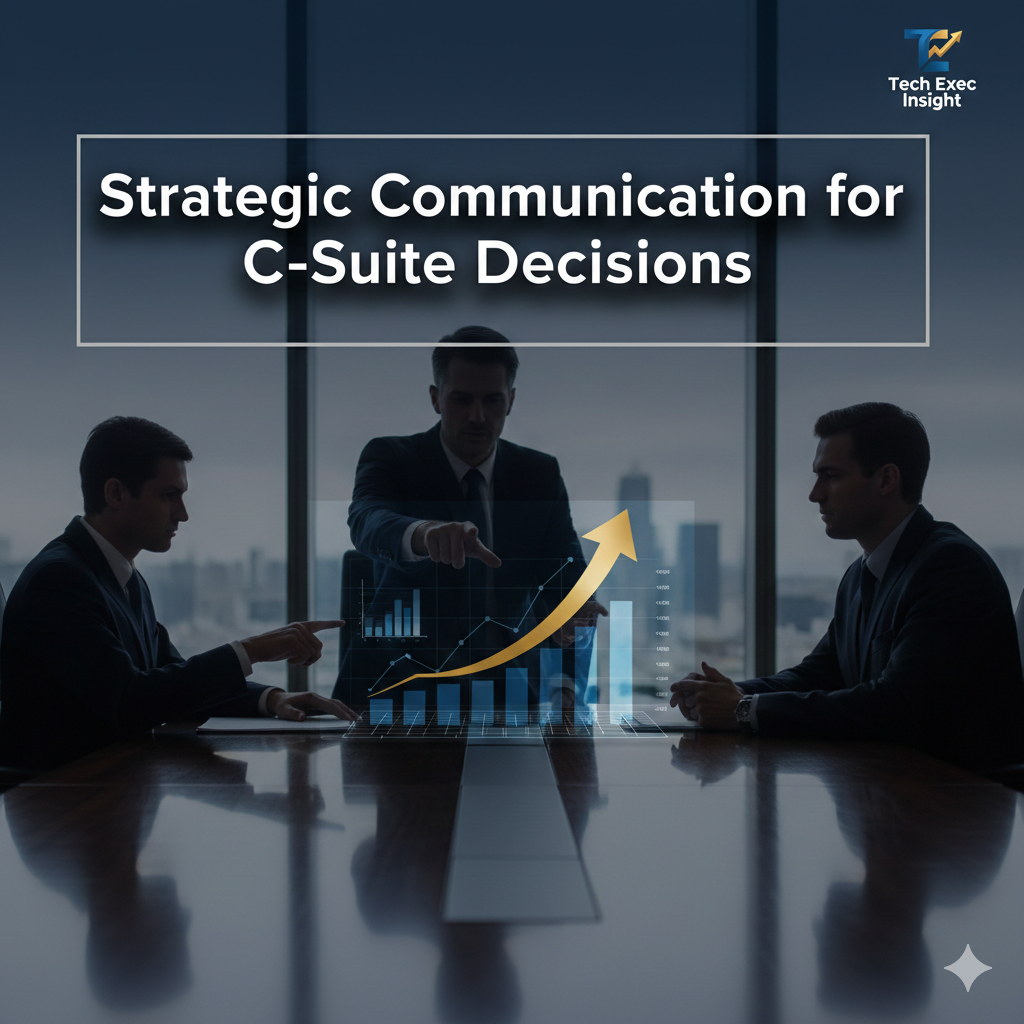
Presenting to Senior Leaders and Board Members
How to communicate technical strategy at the highest levels of your organization
You have 15 minutes with the CEO and CFO. Your presentation deck has 47 slides meticulously detailing your technical roadmap. Three minutes in, the CEO interrupts: "So what's this going to cost, and how does it help us beat the competition?"
You just learned a hard lesson: Executive communication is fundamentally different from technical communication. At the C-suite and board level, time is scarce, stakes are high, and patience for technical details is near zero. What matters is strategy, competitive positioning, risk management, and financial impact—delivered in a format that matches how they learn and make decisions.
Here's how to present technical vision and investment proposals to senior leaders in a way that gets approvals, not confusion.
Understanding the Executive Mindset
Before adapting your communication style, understand what executive leaders are optimizing for:
What Executives Think About
- Strategic positioning: Are we winning or losing? What's our competitive moat?
- Capital allocation: Is this the best use of our limited resources?
- Risk management: What keeps me up at night? How do we mitigate existential threats?
- Market dynamics: What are customers demanding? What are competitors doing?
- Financial performance: How does this impact revenue, margin, valuation?
- Organizational capability: Do we have the talent and culture to execute?
- Time sensitivity: What's urgent vs. important? What's the window of opportunity?
Key insight: Executives don't care about your technical architecture. They care whether technology enables or blocks their strategic goals. Your job is to translate technical decisions into strategic outcomes.
The Four Learning Styles for Executive Communication
Visual Executive Learners
How they process information: Through strategic frameworks, positioning maps, and data visualization. They think in patterns and competitive landscapes.
Communication Strategies:
1. One-Slide Strategy Maps
Distill your entire proposal into a single visual that shows current state, competitive position, and future direction.
Example: Proposing Cloud Migration to Board
Visual Strategy Map (single slide):
- Left side - "Where We Are": On-premises infrastructure icon with labels: "Fixed capacity", "$8M annual cost", "3-week deployment cycles", "Single region (US-East)"
- Center - "Market Shift": Arrows showing: "Competitors migrated 2020-2022", "New EU data residency regulations", "Customer expectation: 99.99% uptime"
- Right side - "Where We Need to Be": Cloud icon with labels: "Elastic capacity", "$5.2M annual cost", "Daily deployments", "Multi-region (US, EU, APAC)"
- Bottom - Investment & Timeline: "$2.8M one-time migration", "18-month phased rollout", "ROI: 14 months"
2. Risk/Reward Matrices
Use 2x2 quadrant charts to show investment options and trade-offs:
- X-axis: Implementation complexity (Low → High)
- Y-axis: Strategic impact (Low → High)
- Quadrants:
- High Impact / Low Complexity = "Quick Wins" (Do first)
- High Impact / High Complexity = "Strategic Bets" (Plan carefully)
- Low Impact / Low Complexity = "Low-Hanging Fruit" (If time permits)
- Low Impact / High Complexity = "Money Pits" (Avoid)
Example: Prioritizing Technical Investments
2x2 Matrix showing 8 potential projects:
- Quick Win (High Impact / Low Complexity): "API Performance Optimization" – $600K revenue impact, 6-week implementation
- Strategic Bet (High Impact / High Complexity): "Platform Modernization" – $3M revenue impact, 18-month implementation
- Money Pit (Low Impact / High Complexity): "Legacy System Rewrite" – $200K savings, 24-month implementation (DON'T DO)
Recommendation: "We propose executing the three Quick Wins in Q1 while planning the Platform Modernization for Q2 start."
3. Competitive Positioning Charts
Show where you stand relative to competitors on dimensions that matter:
- Market adoption curves: Plot your company + 3-4 competitors on technology adoption timeline
- Capability matrices: Score yourself vs. competitors on key technical capabilities that drive customer value
- Gartner-style quadrants: Vision vs. execution, showing competitive landscape
4. Financial Impact Visualizations
Show money in motion—executives think in financial terms:
- Waterfall charts: Current revenue → lost revenue from downtime → potential revenue with improvements → net impact
- Payback timeline: Visual showing cumulative cost vs. cumulative benefit crossing over at ROI point
- Scenario modeling: Best case / base case / worst case outcomes with probabilities
What to Avoid:
- Technical architecture diagrams
- Dense slides with paragraph text
- More than one key message per slide
- Charts without clear "so what?" labels
Auditory Executive Learners
How they process information: Through concise verbal narratives, strategic storytelling, and Q&A dialogue. They want to hear your conviction and reasoning.
Communication Strategies:
1. Lead with the Punch Line
Executive attention span for preamble is approximately zero seconds. Start with the answer, then explain if asked.
Example: Requesting AI Investment
Wrong: "Let me provide background on our current customer support operations. We handle 50,000 tickets monthly. Our average resolution time is 8 hours. Industry benchmarks suggest..."
Right: "We can cut customer acquisition cost by 40% and improve satisfaction scores by 20 points in Q3 by deploying AI-powered support automation. This requires $1.2M investment with 11-month payback. Here's how."
2. The "Rule of Three" Structure
Executives remember three things. Give them three key points, each in three minutes:
15-Minute Executive Presentation Structure
Minute 1-2: The Punch Line
What you're asking for and why it matters (business outcome, not technology)
Minute 3-7: Three Key Points
- Point 1 (Strategic Context): "Why now? Market dynamics, competitive pressure, or customer demand creating urgency"
- Point 2 (Business Impact): "Quantified outcomes: revenue lift, cost savings, risk mitigation"
- Point 3 (Feasibility): "How we'll execute: timeline, team, proven approach"
Minute 8-10: Risk & Mitigation
Acknowledge top concerns before they ask. Show you've thought it through.
Minute 11-15: Q&A and Decision
What you need from them and when.
3. Strategic Storytelling
Frame technical decisions as competitive narratives:
Example: Proposing Security Investment
"Three months ago, our largest competitor suffered a ransomware attack. They were offline for 6 days. Lost $18M in revenue. Their stock dropped 12%. Customers fled to us—we gained 2,000 new accounts that quarter.
But here's the problem: We're vulnerable to the same attack vector. Our security posture is actually weaker than theirs was. If we get hit, the damage is estimated at $35M based on our current scale.
I'm asking for $2.3M to implement zero-trust architecture and advanced threat detection. This investment protects us from the scenario that just killed our competitor's quarter and creates a competitive advantage we can market: 'Enterprise-grade security for mid-market pricing.'
The alternative is gambling that we won't be next."
4. Anticipate Objections Verbally
Don't wait for objections—address them proactively:
- "You might be thinking, 'Can't we wait until next year?'" Then explain why timing matters
- "The obvious question is cost." Then show ROI immediately
- "Some of you might worry about execution risk." Then cite your mitigation plan
5. Use Competitive Reference Points
Executives benchmark constantly. Give them reference points:
- "When Amazon did this in 2018, they reduced costs by 35% and improved customer experience scores by 18 points"
- "Every major player in our space has made this transition. We're now 2-3 years behind the curve"
- "This is table stakes for enterprise deals. We've lost 4 major opportunities because we can't support multi-region deployment"
What to Avoid:
- Reading slides word-for-word
- Technical jargon without translation
- Burying the ask until the end
- Rambling without structure
Reading/Writing Executive Learners
How they process information: Through structured written documents, frameworks, and analytical memos. They want time to read and reflect before deciding.
Communication Strategies:
1. The Amazon-Style 6-Page Memo
Write a narrative document (not slides) sent 48 hours before the meeting:
6-Page Memo Structure
Page 1: Executive Summary
- One paragraph: What you're proposing and why
- Strategic context: Market dynamics, competitive pressure
- Business impact: Quantified outcomes
- Investment required: Cost and timeline
- Recommendation: What you need from them
Pages 2-3: Strategic Rationale
- Current state and limitations
- Market/competitive analysis
- Customer/revenue impact if we act
- Customer/revenue impact if we don't act
Pages 4-5: Execution Plan
- High-level approach (no technical details)
- Phased timeline with business milestones
- Team and resource requirements
- Success metrics and tracking
Page 6: Risk Analysis & FAQ
- Top 5 risks with mitigation plans
- FAQ addressing predictable objections
2. Decision Frameworks
Provide structured criteria for evaluating your proposal:
Example: Investment Decision Framework
| Evaluation Criteria | Weight | Score (1-10) | Weighted Score | Justification |
|---|---|---|---|---|
| Strategic Alignment | 30% | 9 | 2.7 | Directly enables international expansion goal |
| Financial Return | 25% | 8 | 2.0 | 14-month payback, 87% IRR |
| Competitive Necessity | 20% | 9 | 1.8 | 4/5 competitors already have this capability |
| Execution Risk | 15% | 7 | 1.05 | Proven technology, experienced team |
| Time to Value | 10% | 6 | 0.6 | First benefits in 6 months, full value at 18 months |
| Total Score | 8.15/10 | Strong Recommend | ||
3. Financial Models with Scenarios
Build spreadsheet models showing best/base/worst case outcomes:
| Scenario | Probability | Revenue Impact | Cost Impact | Net Impact (3-Year) | ROI |
|---|---|---|---|---|---|
| Best Case | 20% | +$8.2M | -$2.1M | +$6.1M | 290% |
| Base Case | 60% | +$5.4M | -$2.3M | +$3.1M | 135% |
| Worst Case | 20% | +$2.8M | -$2.6M | +$0.2M | 8% |
| Expected Value | 100% | +$3.34M (weighted average) | 145% | ||
4. Comparative Analysis
Show alternatives you considered and why your recommendation wins:
Example: Build vs. Buy vs. Partner Analysis
| Option | Cost | Time to Market | Strategic Control | Recommendation |
|---|---|---|---|---|
| Build In-House | $4.2M + $800K/yr | 18-24 months | Full control | ❌ Too slow |
| Buy SaaS Platform | $1.2M/yr | 3 months | Limited customization | ✅ Recommended |
| Partner Integration | $600K + rev share | 6 months | Dependency risk | ⚠️ Backup plan |
Rationale: "SaaS platform gets us to market 15 months faster than building, proven technology reduces execution risk, and $1.2M annual cost is 40% cheaper than in-house total cost of ownership."
5. Appendices for Deep Dives
Keep main document short (6 pages max). Put technical details, vendor analysis, and supporting data in appendices. Reading/writing learners will read them if interested.
What to Avoid:
- Presenting verbally without written pre-read
- Dense technical documentation without executive summary
- Asking for decisions in the meeting without time to reflect
- Sloppy writing—at this level, writing quality signals thinking quality
Kinesthetic Executive Learners
How they process information: Through live demonstrations, pilot results, and tangible proof points. They trust what they can see working.
Communication Strategies:
1. Lead with Pilot Results
Don't ask for $5M based on a business case. Ask for $200K to prove it works, then show results.
Example: Two-Phase AI Investment
Phase 1 Request (2 months ago): "$250K for 8-week pilot: Build recommendation engine for top 50 products, measure conversion lift"
Pilot Results (presenting today):
- 27% conversion rate improvement on pilot products
- $180K incremental revenue in 6 weeks
- Customer feedback: 4.3/5 satisfaction with recommendations
- Technical proof: System handles 10K requests/sec with 120ms latency
Phase 2 Request (now): "$1.8M to scale across all 5,000 products. Based on pilot results, projected $4.2M annual revenue lift. Payback in 5 months."
2. Live Demonstrations
Show working software, not slide decks. Let executives interact with it.
Example: Proposing Customer Analytics Platform
Wrong: 20 slides showing mockups and explaining features
Right: "Here's the platform running on real data from last quarter. [Opens browser]
- This dashboard shows customer churn risk. See these 47 accounts in red? They're predicted to churn in next 30 days. Combined value: $1.2M ARR.
- [Clicks on account] Here's why the model flagged them: 60% reduction in usage, 3 support tickets in 2 weeks, no executive engagement in 90 days.
- [Clicks action button] One click alerts customer success to intervene. In our 60-day pilot with the CS team, they saved 12 of 18 flagged accounts. That's $420K retained revenue.
- Now you try it—click on any account and see the underlying data."
3. Customer Visit or Ride-Along
Let executives see the problem firsthand:
- Shadow a customer support call to hear customer pain points
- Visit a customer site to see how they struggle with current product limitations
- Watch sales demo where you lose deals due to missing capabilities
- Monitor operations during incident to see chaos from lack of tooling
4. Incremental Evidence
Show progressive validation through staged rollouts:
Evidence-Based Proposal Structure
Stage 1 (Completed): 2-week technical spike
Result: Proof of feasibility, identified technical risks
Stage 2 (Completed): 6-week pilot with 1 team
Result: 35% productivity improvement, team satisfaction 4.6/5
Stage 3 (Completed): 8-week expansion to 3 teams
Result: Consistent productivity gains, operational cost down 20%
Stage 4 (Requesting): Full rollout to 15 teams
Projected Impact: $2.8M annual productivity value, $600K cost savings
Investment: $1.2M implementation + $200K/yr licensing
5. Competitor Evidence
Show what's already proven to work elsewhere:
- Industry case studies: "Here's how Competitor X achieved 40% cost reduction with similar approach"
- Analyst reports: "Gartner rates this as 'Must Have' for companies at our scale"
- Reference customers: "I spoke with the CTO at [similar company]. Happy to arrange call."
What to Avoid:
- Asking for large investments without proof of concept
- Theoretical ROI without pilot data
- Slide decks when you could show working product
- Projections when you could show results
The Complete Executive Presentation: Multi-Modal Approach
The most effective executive presentations combine all four modalities:
Complete Board Presentation Template
48 Hours Before Meeting (Reading/Writing):
- Send 6-page memo with executive summary, strategic rationale, financial model, risk analysis
- Include appendix with pilot results, competitive analysis, vendor evaluation
Meeting: First 3 Minutes (Auditory):
- Verbal punch line: "We're requesting $2.3M to implement X, which will deliver $6.8M revenue impact over 3 years with 11-month payback"
- Strategic story: "Here's why this matters now: [competitive context, market shift, customer demand]"
Meeting: Minutes 4-7 (Visual):
- One-slide strategy map showing current state, competitive position, future state
- Risk/reward matrix showing this investment vs. alternatives
- Financial waterfall showing investment → benefits → net impact
Meeting: Minutes 8-12 (Kinesthetic):
- Show pilot results: "We already tested this with 3 teams for 8 weeks. Here are the results."
- Live demo: "Here's the platform running on real data. You can interact with it."
- Customer evidence: "Here's video feedback from beta customers."
Meeting: Minutes 13-20 (Q&A All Styles):
- Address objections
- Reference written materials for details
- Show supporting data visualizations
- Point to pilot evidence
Common Executive Presentation Mistakes
1. Starting with Technology Instead of Strategy
Wrong: "We're proposing a Kubernetes-based microservices architecture..."
Right: "We need to move 10x faster than competitors while cutting infrastructure costs by 40%. Here's how..."
2. Burying Financial Impact
Wrong: Putting ROI on slide 37 of 40
Right: Lead with: "$2.3M investment, $6.8M return, 11-month payback. Here's how we get there..."
3. Ignoring Competitive Context
Wrong: Presenting in a vacuum as if you're the only company that exists
Right: "Four of our top 5 competitors have already made this transition. We're 18 months behind. Here's what that means for our win rates..."
4. Over-Confidence Without Evidence
Wrong: "This will definitely deliver 35% improvement..."
Right: "In our 8-week pilot, we measured 35% improvement. Industry benchmarks suggest 25-40% range. We're modeling conservatively at 28%."
5. Ignoring Risk
Wrong: Presenting as if nothing could go wrong
Right: "The top three risks are [X, Y, Z]. Here's how we're mitigating each one..."
Real-World Example: Complete Executive Proposal
Scenario: Requesting $3.5M Platform Modernization Investment
Pre-Read Memo (Reading/Writing):
Executive Summary: We're requesting $3.5M investment over 18 months to modernize our platform architecture. This will reduce time-to-market from 3 weeks to 2 days, cut infrastructure costs by $1.8M annually, and eliminate the technical constraints blocking our enterprise sales motion. ROI: 16 months.
Strategic Context: Our top 3 competitors completed similar modernization 2020-2022. We're losing enterprise deals because we can't support multi-region deployment, custom SLAs, or enterprise security requirements. Sales pipeline shows $12M in stalled opportunities specifically due to these technical gaps.
Pilot Results: We've already migrated checkout service as proof of concept. Results: 85% performance improvement, 92% reduction in outages, $140K annual cost savings on that one service. This validates the approach.
Verbal Opening (Auditory):
"We have $12M in enterprise pipeline that we can't close because our platform can't meet enterprise requirements. Our competitors solved this two years ago. I'm asking for $3.5M to modernize our architecture, which will unlock that pipeline, cut infrastructure costs by $1.8M annually, and get us to parity with competitors. We've already proven this works—we migrated one service and got 85% better performance with 92% fewer outages. Now we need to scale it."
Visual Slides:
- Slide 1: Strategy map showing "Where we are" (single region, slow deployments, enterprise gaps) → "Where competitors are" → "Where we need to be"
- Slide 2: Financial waterfall: $12M stalled pipeline + $1.8M annual savings – $3.5M investment = $10.3M net impact (3 years)
- Slide 3: Risk matrix: Top 4 risks with mitigation (Phased approach, proven technology, experienced team, pilot validation)
Kinesthetic Evidence:
"Here's the new architecture running in production for our checkout service. [Opens monitoring dashboard] You can see latency dropped from 800ms to 120ms. Uptime went from 99.1% to 99.9%. This is the service handling 60% of our revenue—we proved it works where it matters most. Now we're asking to apply the same approach to the remaining services."
Result: Approved with condition: "Deliver next 3 services in Q1 and show similar results before we fund the full program."
Your Action Plan
Before Your Next Executive Presentation:
- Identify decision-maker learning styles – Review past presentations. Do they engage with visuals, ask for written pre-reads, tell stories, or demand proof points?
- Write the punch line first – If you had 30 seconds, what would you say? Start there.
- Translate everything to business outcomes – Revenue, cost, risk, competitive advantage
- Prepare multi-modal materials – Written memo, visual slides, verbal narrative, pilot results or demo
- Show competitive context – What are others doing? What's at stake if we don't act?
- Build credibility with evidence – Pilots > projections, case studies > theories
- Anticipate top 5 objections – Have answers ready
- Rehearse the 15-minute version – You rarely get more time
Key Takeaways
- Executives care about strategy, not technology – Translate technical decisions into competitive positioning and financial outcomes
- Lead with the punch line – What you're asking for, why it matters, business impact
- Adapt to learning styles – Use strategy maps for visual learners, storytelling for auditory learners, memos for reading/writing learners, pilot results for kinesthetic learners
- Multi-modal wins at this level – Combine written pre-read + visual slides + verbal narrative + live demo/pilot results
- Evidence beats projections – Pilot your way to yes with incremental validation
- Address risk explicitly – Show you've thought through what could go wrong
- Show competitive context – Executives benchmark constantly; give them reference points
Executive communication isn't about dumbing down your technical vision—it's about elevating it to strategic language. When you master the art of translating technology decisions into business outcomes and adapt your delivery to executive learning styles, you don't just get budget approvals. You position yourself as a strategic partner who understands how technology drives business success.
Downloadable Resources
Prepare for your next C-suite or board presentation with these templates:
- 6-Page Executive Memo Template - Amazon-style narrative document for complex technical decisions
- Executive Decision Framework - Weighted scoring matrix to systematically evaluate strategic options
- Strategy Map Template - Visual representation of current state, competitive gap, and future vision