 Tech Exec Insight
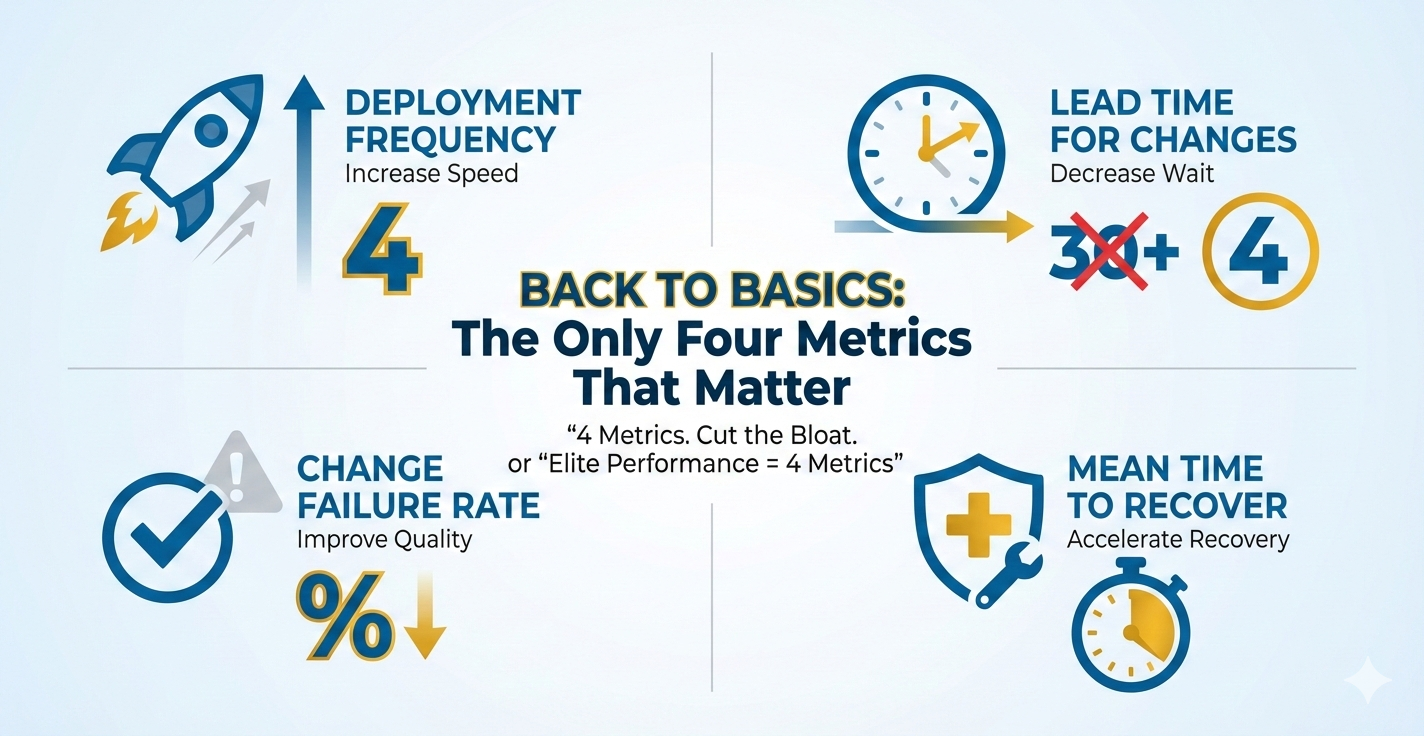
Back to Basics: The Only Four Metrics That Matter
We're drowning in metrics. Dashboard sprawl, vanity metrics, and "nice-to-have" tracking consume time that should go into shipping. Meanwhile, teams struggle to answer the simplest question: Are we getting better?
Through my work with tech leaders and engineering teams, I've found that Google's DORA (DevOps Research and Assessment) metrics provide the most effective framework for measuring what actually matters. These four metrics consistently predict software delivery performance and organizational outcomes. As a tech executive or engineering manager, adopting these metrics will help you cut through the noise and focus on what drives real results: speed, stability, and the ability to recover quickly.
The Four DORA Metrics
1. Deployment Frequency (DF)
What it measures: How often your organization successfully releases code to production.
Why it matters: Higher deployment frequency correlates with smaller, safer changes and faster feedback loops. It's a proxy for your team's ability to deliver value continuously.
How to measure: Count completed deployments to production per day, week, or month. Include only successful deployments that reach users.
Example calculation:
In the last 30 days, your team completed 45 production deployments.
Deployment Frequency = 45 deployments ÷ 30 days = 1.5 deployments per day
This puts you in the Elite tier (multiple per day).
Elite target: Multiple deployments per day
High target: Between once per week and once per month
2. Lead Time for Changes (LT)
What it measures: The time from code commit to code running successfully in production.
Why it matters: Short lead times enable rapid iteration, faster pivots, and quicker response to market feedback. Long lead times often indicate process bottlenecks or technical debt.
How to measure: Track timestamp from commit to production deployment. Exclude wait time between batches; focus on flow time for individual changes.
Example calculation:
Commit made Monday at 10:00 AM → Deployed to production Tuesday at 2:00 PM
Lead Time = 28 hours (1 day, 4 hours)
Calculate average across all deployments: Total lead time hours ÷ Number of deployments
If your average is 18 hours, you're in the Elite tier (<1 day).
Elite target: Less than one day
High target: Between one day and one week
3. Change Failure Rate (CFR)
What it measures: The percentage of deployments causing a failure in production (requiring hotfix, rollback, fix-forward, or patch).
Why it matters: This balances speed with quality. You can deploy fast, but if every third deploy breaks production, you're not actually delivering value—you're creating chaos.
Critical clarification: This is NOT the percentage of all bugs in production. CFR measures deployment-caused incidents that require immediate remediation—critical items that keep customers or people from utilizing the system.
Examples of deployment-caused incidents that count as failures:
- Application crashes or won't start after deployment
- Critical user flows break (login, checkout, search, payment processing)
- Database migration causes data corruption or system downtime
- API endpoints return 500 errors preventing customer transactions
- Performance degradation so severe users cannot complete tasks (e.g., page load times exceed 30 seconds)
- Security vulnerability introduced that requires immediate rollback
- Integration failures that block core business operations
What does NOT count: Minor UI bugs, cosmetic issues, non-critical feature defects discovered days later, or issues that don't require immediate action.
How to measure: (Failed deployments ÷ Total deployments) × 100. Define "failure" clearly: any deployment causing a critical incident requiring immediate remediation.
Example calculation:
Last month: 50 total deployments, 5 required immediate rollback or hotfix
CFR = (5 ÷ 50) × 100 = 10%
This puts you in the Elite tier (0-15%).
Elite target: 0-15% (when deploying multiple times daily, even 10% means 9 of 10 deployments succeed)
High target: 16-30%
Important context: If you deploy once per month with massive changes, even a 5% failure rate is catastrophic. But if you deploy 20 times per day with small, tested changes, a 10% rate means you catch and fix issues quickly with minimal customer impact. The goal is to pair low CFR with high deployment frequency and fast MTTR.
4. Mean Time to Recover (MTTR)
What it measures: How long it takes to restore service when an incident or defect impacts users.
Why it matters: Failures are inevitable. Elite teams don't avoid failures—they recover from them rapidly. Fast MTTR minimizes customer impact and business risk.
How to measure: Time from incident detection to full service restoration. Average this across all incidents in your measurement window.
Example calculation:
Last quarter incidents: 45 min, 2 hrs, 30 min, 1.5 hrs, 20 min
Convert to minutes: 45 + 120 + 30 + 90 + 20 = 305 minutes
MTTR = 305 ÷ 5 incidents = 61 minutes (just over 1 hour)
At 61 minutes average, you're at the edge of Elite tier (<1 hour).
Elite target: Less than one hour
High target: Less than one day
DORA Performance Benchmarks
| Metric | Elite | High | Medium | Low |
|---|---|---|---|---|
| Deployment Frequency | On-demand (multiple per day) |
Between once per week and once per month | Between once per month and once per six months | Fewer than once per six months |
| Lead Time for Changes | Less than one day | Between one day and one week | Between one week and one month | Between one month and six months |
| Change Failure Rate | 0-15% | 16-30% | 31-45% | 46-60% |
| Mean Time to Recover | Less than one hour | Less than one day | Between one day and one week | Between one week and one month |
Why Only These Four?
DORA's research proves these four metrics predict:
- Organizational performance: Profitability, market share, productivity
- Team well-being: Lower burnout, higher job satisfaction
- Product quality: Customer satisfaction and retention
- Security outcomes: Elite performers integrate security earlier and recover faster from vulnerabilities
Unlike vanity metrics (lines of code, story points, velocity), these four directly tie to business outcomes. They balance speed and stability. They reveal system-level constraints rather than individual performance.
Getting Started: A 30-Day Baseline
Don't boil the ocean. Start with manual tracking if you must, but start now.
Week 1: Define and Align
- Gather engineering, product, and ops leaders
- Define what "deployment," "failure," and "incident" mean for your context
- Pick your measurement window (recommend: rolling 30 days)
- Document definitions in a shared location
Week 2: Instrument
- Deployment Frequency: Query your CI/CD (Continuous Integration/Continuous Deployment) tool or deployment logs
- Lead Time: Track commit timestamps and deployment timestamps; calculate delta
- Change Failure Rate: Tag deployments that require hotfix/rollback in your incident tracker
- MTTR: Use incident management tool timestamps (incident start → incident resolved)
Week 3: Establish Your Baseline
- Calculate each metric for the past 30 days
- Plot your position against DORA benchmarks
- No judgment—this is your starting line
Week 4: Identify One Constraint
- Which metric is furthest from your target tier?
- What's the primary blocker? (Manual testing? Long code review cycles? Unstable test environments?)
- Define one experiment to improve that constraint over the next 30 days
Common Anti-Patterns to Avoid
1. Using Metrics as Weapons
DORA metrics measure system performance, not individual performance. Using them to rank engineers or teams triggers gaming behaviors and destroys trust. Focus on trends and system-level improvements.
2. Optimizing One Metric in Isolation
Don't chase deployment frequency while ignoring change failure rate. These metrics work as a balanced system. Elite teams excel across all four.
3. Adding "Just One More" Metric
Resist the urge to bolt on code coverage, test pass rates, or story points. You can track those separately, but keep your executive dashboard focused on these four. Complexity kills clarity.
4. Waiting for Perfect Tooling
Start with spreadsheets if necessary. Manual tracking for 30 days beats waiting six months for the "perfect" observability platform. Automate once you prove the value.
What Gets Retired?
Once you adopt DORA metrics, consider sunsetting:
- Lines of code written: More code is often worse code
- Story points completed: Velocity doesn't measure value delivered
- Code coverage percentage: Useful for teams, not for execs—high coverage doesn't guarantee quality
- Number of commits: Favors activity over outcomes
- Utilization/capacity metrics: Optimize for flow, not factory efficiency
These aren't useless—they're just not strategic. Push them to team-level dashboards where they can inform tactical decisions.
Real-World Impact
Organizations that improve their DORA metrics see measurable business outcomes:
- 2x faster time-to-market for new features
- 50% reduction in unplanned work and firefighting
- 3x higher customer satisfaction scores due to faster bug fixes and feature iteration
- Lower employee burnout (DORA research shows elite performers report 2.5x less burnout than low performers)
Next Steps
- Commit to measurement: Pick a start date and measure for 90 days without changing anything. Establish your true baseline.
- Make metrics visible: Post them in team spaces, all-hands meetings, and executive dashboards. Transparency drives improvement.
- Run experiments: Tackle one constraint at a time. Measure before and after. Double down on what works.
- Review quarterly: Are you moving toward elite performance? If not, what systemic blocker needs to be addressed?
Downloadable Resources
Looking for practical tools to implement these metrics? Check out these resources:
- Metrics Quick Sheet — Download
- SLO Starter Pack — Download
- Blameless Postmortem Template — Download
- Release Guardrail Template — Download
Acronym Guide
- DORA — DevOps Research and Assessment
- DF — Deployment Frequency
- LT — Lead Time for Changes
- CFR — Change Failure Rate
- MTTR — Mean Time to Recover
- CI/CD — Continuous Integration/Continuous Deployment
- SLO — Service Level Objective
- SLA — Service Level Agreement
- SLI — Service Level Indicator